ADA compliance and video testimonials
Share One was alerted about a case where a business was served an unlimited lawsuit for posting a video not in ADA compliance. The company did not have closed captioning for the hearing-impaired video. Let’s dive in on how your testimonials can be impacted and be ADA compliant!
Key Takeaways
ADA compliance in video testimonials ensures accessibility for individuals with disabilities, fostering inclusivity and expanding audience reach.
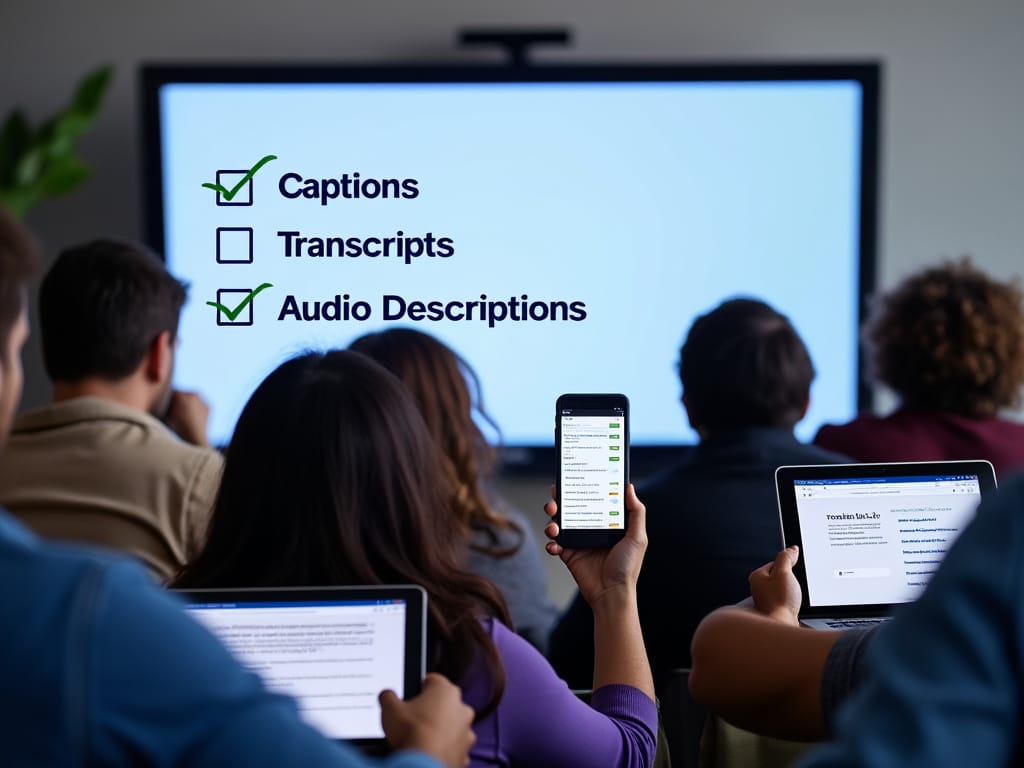
Adding captions, transcripts, and audio descriptions improves user experience and SEO, boosting visibility and engagement.
Non-compliance with accessibility standards can result in legal penalties, reputational damage, and lost opportunities to connect with diverse audiences.
Features like closed captions, accessible video players, and audio descriptions enable effective communication and align with ADA regulations and WCAG guidelines.
ADA-compliant videos demonstrate your brand’s commitment to equality, enhancing trust, credibility, and customer loyalty.
Planning inclusivity from the start reduces challenges, protects your business, and positions you better in competitive markets.
Table of Contents
The Americans with Disabilities Act (ADA) is in place to make the world accessible to individuals with disabilities. A recent study revealed that a whopping 91% of businesses will use videos as part of their marketing campaigns in 2023, so it’s vital that ADA compliance guidelines are followed.
What Is ADA Compliance?
ADA compliance refers to meeting the standards of the Americans with Disabilities Act (ADA) of 1990, designed to prevent discrimination against individuals with disabilities. Compliance with digital content, including video testimonials, requires accessibility features like captions, transcripts, and audio descriptions.
Under ADA Title III, businesses and organizations considered “public accommodations” must make their services and products accessible to people with disabilities. This covers every business selling anything online and extends to websites and online domains.
Most content creators aren’t thinking about the ADA when creating online content and videos, but Title II of the Act specifies guidelines surrounding recording and editing publicly available videos so that people with disabilities can access the information.
These features enable people with disabilities, including 42 million individuals in the United States, to access and engage with your content. Noncompliance risks legal penalties, as the ADA applies to businesses and organizations offering goods or services to the public.
Legal Protection: ADA Titles II and III mandate accessible videos for government entities, private businesses, and nonprofits, reducing lawsuits and penalties related to noncompliance.
Improved Audience Reach: ADA-compliant video testimonials reach more viewers, expanding access to potential customers often overlooked due to accessibility barriers.
Enhanced User Engagement: Captions and transcripts make your content searchable, improving SEO rankings. Accessible features also provide better user experiences, increasing engagement and conversions.
Credibility and Inclusivity: Meeting ADA guidelines reflects positively on your brand, showing that you care about inclusivity while building trust and customer loyalty.
Implementing ADA compliance for video testimonials ensures your business stands out in competitive markets, aligns with accessibility laws, and makes meaningful connections with all users.
Legal Requirements for Video Accessibility
Ensuring your video testimonials meet accessibility standards expands audience reach and aligns with ADA compliance. Accessible videos also foster inclusivity and protect your business from legal risks.

The Americans with Disabilities Act (ADA) requires digital content, including videos, to be accessible to individuals with disabilities. Title II and Title III implicitly demand “auxiliary aids” for effective communication, which cover features like closed captions and audio descriptions. These accommodations ensure individuals with auditory, visual, or cognitive disabilities can access your video testimonials without barriers.
Adhering to Web Content Accessibility Guidelines (WCAG) is crucial for compliance. Closed captions should provide a synchronized textual representation of spoken words and sounds. Audio descriptions narrate significant visual elements during dialogue pauses, enabling visually impaired viewers to engage with your content. Text transcripts summarizing dialogue and non-verbal elements improve accessibility and allow users to interact with your content across various formats.
Consequences of Non-Compliance
Non-compliance with video accessibility standards exposes your business to lawsuits, fines, and reputational damage. ADA violations carry penalties exceeding $75,000 for a first offense. These costs significantly affect small and mid-sized companies, especially if corrective measures require urgent implementation.
Failing to comply creates accessibility gaps, alienating a substantial portion of the population living with disabilities. This oversight damages your credibility and diminishes your ability to connect with diverse audiences. Making video testimonials accessible shows a commitment to inclusivity, preserving customer trust, and expanding your long-term market reach.
Key Components of Accessible Video Testimonials
Accessible video testimonials ensure inclusivity while expanding audience reach. They comply with ADA standards, facilitating engagement with diverse viewers.
Closed Captions and Subtitles
Closed captions provide an essential text-based representation of your video’s audio. These include dialogue, sound effects, and speaker identification, catering to over 11.5 million Americans with hearing loss. Subtitles can further broaden accessibility for non-native speakers. Captions also enhance engagement in noisy settings or during silent viewing, increasing user satisfaction and SEO rankings. Use concise text, note speaker changes, and include non-speech sounds for full accessibility.
Audio Descriptions
Audio descriptions verbalize on-screen visuals, helping blind or visually impaired viewers grasp non-verbal elements. They narrate actions, expressions, and setting details during natural pauses in audio. With almost 12 million Americans experiencing vision impairments, audio descriptions illustrate context for a comprehensive user experience. Prioritize key visual features and avoid overloading descriptions to maintain clarity.
Transcripts for Better Accessibility
Audio transcriptions are a requirement of Web Content Accessibility Guidelines (WCAG). While nothing is codified into law, U.S. courts frequently reference the Web Content Accessibility Guidelines (WCAG) as the standards websites should meet to be considered ADA-compliant.
Transcripts enhance understanding and usability by allowing users to read at their own pace—search engines also index transcripts, improving discoverability and SEO value. Also, it allows you to repurpose your content on multiple platforms!
Accessible Video Players
Accessible video players allow seamless navigation for users relying on assistive technologies like screen readers or keyboards. Features like keyboard shortcuts, adjustable playback speed, and contrast settings align with WCAG standards and ADA requirements—test video players against accessibility guidelines to ensure ease of use across devices.
Planning Inclusive Content
Incorporate accessibility at the planning stage to reduce post-production challenges. Consider your audience’s diverse needs, such as sensory or cognitive impairments. Opt for high-contrast visuals, clear fonts, and minimal background noise. Aligning inclusivity with your strategy maximizes reach and showcases your brand’s dedication to equitable experiences. How could prioritizing accessibility reshape your content’s impact?
The company AccessiBe has put together an ADA compliance checklist here.
Benefits of ADA-Compliant Video Testimonials
ADA-compliant video testimonials empower businesses to connect with wider audiences while fostering inclusivity and legal compliance. They offer tangible advantages in audience reach and engagement.
Broader Audience Appeal
ADA-compliant videos expand your message’s reach. Accessibility features ensure individuals with disabilities can engage effectively. For example, closed captions support those with hearing impairments, while audio descriptions aid visually impaired viewers. Your brand resonates more deeply by including diverse audiences, building universal appeal. Data shows that ADA-compliant video content allows you to tap into a broader demographic, enhancing relatability and trust.
Accessibility improves international reach. Transcripts and captions also assist non-native speakers in understanding your content, removing linguistic barriers. This inclusivity signals your commitment to equity and creates a competitive edge in saturated markets.
Enhanced User Engagement
Accessible videos increase engagement. Captions boost retention and make your content easier to consume in various settings, like noisy environments. For instance, engagement rates can rise by over 200% with video testimonials, as they’re inherently more compelling than text-based content. ADA compliance enhances this effect by ensuring no user is left out.
Improved engagement strengthens SEO performance. Search engines value accessibility features like transcripts as they increase keyword density and usability. This helps your content rank higher, driving organic traffic and reinforcing credibility.
ADA-compliant video testimonials aren’t merely ethical; they’re strategic. Are you maximizing every possible opportunity to connect, engage, and grow?
Tools and Strategies for Compliance
Ensuring ADA compliance in video testimonials enhances accessibility and sets your brand apart. Implementing appropriate tools and methodologies streamlines this process.
Useful Accessibility Tools
Using specialized tools ensures your video content adheres to accessibility requirements:
High-Quality Microphones: Produce clear audio tracks for effective lip-reading and compatibility with hearing aids.
Captioning Software: Automatically generate and edit accurate, synchronized captions to meet WCAG standards.
Audio Description Tools: Integrate tracks describing essential visual elements, enabling visually impaired users to engage fully.
Accessible Media Players: Opt for players that support captions, transcripts, and keyboard navigation for seamless user interaction.
aXe Accessibility Checker: Test video compliance and detect issues, ensuring alignment with ADA and WCAG.
Accessible tools save time while amplifying your video’s impact.
Steps To Ensure Your Videos Meet Standards
Achieving fully accessible videos requires a structured approach:
Plan Inclusively: Address accessibility during pre-production, including audio clarity and visual contrast.
Create Accurate Captions: Synchronize text for all dialogues and critical sounds, considering readability through proper font size and contrast.
Include Transcripts: Provide complete textual content of video dialogue and non-speech audio for greater reach.
Add Audio Descriptions: Highlight significant visual elements to ensure equal accessibility for blind viewers.
Enable Keyboard Navigation: Integrate controls that are usable by keyboard-only users without relying on a mouse.
Conduct Rigorous Testing: Use accessibility checkers and manual evaluations to verify compliance.
Following these steps guarantees inclusivity, builds credibility, and reduces legal risks. How could dramatically improving audience engagement with simple strategies transform your brand’s growth?
Frequently Asked Questions (FAQs)
ADA compliance for video testimonials means ensuring videos are accessible to individuals with disabilities by including features like closed captions, transcripts, and audio descriptions, as required by the Americans with Disabilities Act (ADA).
The ADA, under Titles II and III, requires businesses and public entities to provide "auxiliary aids" such as closed captions and audio descriptions for effective communication. Compliance also involves adhering to the Web Content Accessibility Guidelines (WCAG)
Non-compliance can lead to lawsuits, fines exceeding $75,000 for a first offense, and reputational damage. It also excludes a significant portion of the population with disabilities from accessing your content
Include closed captions, audio descriptions, and transcripts. Use accessible video players and plan content with inclusivity in mind, addressing diverse audience needs from the start
Useful tools include high-quality microphones for clear audio, captioning software for accurate captions, audio description tools, accessible media players, and accessibility checkers like aXe.
Plan accessibility from the start by using high-contrast visuals, clear fonts, minimal background noise, and considering the needs of individuals with sensory or cognitive impairments.
Benefits include reaching a broader audience, enhancing user engagement, improving SEO rankings, and showing a commitment to inclusivity, which builds trust and credibility.
Conclusion
Embracing ADA compliance for video testimonials is more than meeting legal requirements. It’s about creating meaningful connections with a diverse audience and showcasing your commitment to inclusivity. By making your content accessible, you protect your business from potential risks, foster trust, improve engagement, and strengthen your brand’s reputation.
When you prioritize accessibility, you’re setting your business apart in a competitive world while ensuring everyone can engage with your message. It’s a wise investment that drives growth, loyalty, and long-term success.
Disclaimer: This post is for general informational purposes and is not intended as legal or ethical advice. All practitioners and advisors are responsible for understanding the legal and ethical guidelines of the governing bodies for their industry and which apply to their situation.